

In 2015, we worked with Hounslow council to explore the potential of existing datasets to understand the resilience of local communities. We’ve now set out on a second phase of this work, looking at how our model helps us understand how community resilience has changed over time. We’ll be publishing more on this later in the year – this blog describes where we have got to so far, and what we hope to do in this next phase.
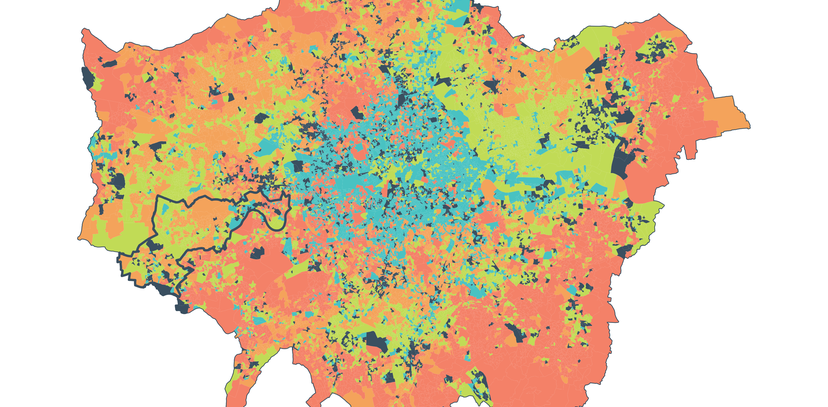
The image above shows our initial mapping of predicated community resience across London, based on the most recent data available from 2014-15. Red/orange areas are likley to have the highest levels of community resiience, blue areas the lowest.
Our starting point was the Wellbeing and Resilience Measurement – or WARM – developed by the Social Life team while still at the Young Foundation. This used modelled data from national surveys to predict community resilience, alongside data that describes places from sources varying from the census to fire incidence statistics.
Our 2015 project involved factor analysis and cluster analysis of the Understanding Society Survey – a powerful longitudinal dataset repeated annually, giving rich data about how we feel about our lives and the world we live in (more on our approach is in this methods paper from 2015). This has enabled us to isolate six “resilience clusters” which we have mapped to Hounslow’s neighbourhoods:
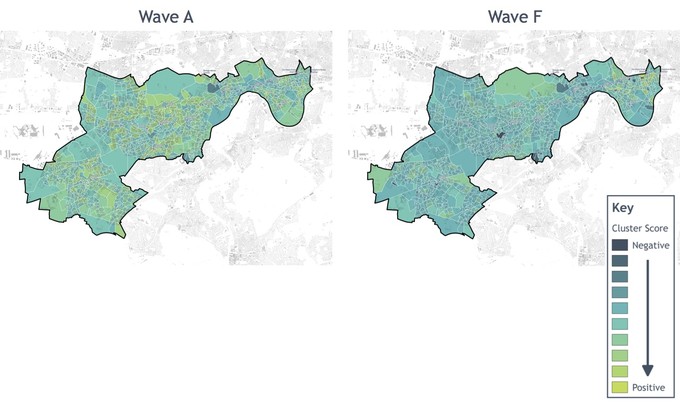
Neighbourhood support cluster mapped across Hounslow, using USS wave A (2009-10) and wave F (2014-15) data
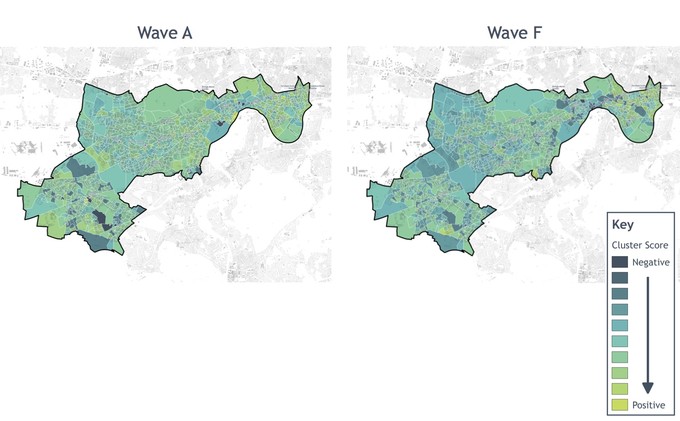
Emotional fragility cluster mapped across Hounslow, using USS wave A (2009-10) and wave F (2014-15) data
Overlaying our clusters with data from a number of different sources that could be broken down to small local areas (ONS's output areas or LSOAs), allows us to see how our prediction of resilience matched to the actual circumstances of Housnlow’s local areas.
Hounslow tell us they are increasingly confident that this approach has value in flagging the places where there are particular issues that are not highlighted by official statistics – this could be where an area is faring better than would be imagined, looking at the official data, or where it is struggling more.
Hounslow and London Councils have used this work as an example of ways that London local government in tackling social integration.
Our next task is to try and understand change over time in our predictive data. We are looking what has happened between 2009-10 and 2014-15 (this is the most recent data available). In these five years Hounslow’s local neighbourhoods experienced the first impacts of austerity and sharp reductions in public sector investment, as well as increasing poverty and inequality.
We are also looking at how the model plays out across London, to see how much Hounslow’s local trends are related to city-wide change.
A critical element of resilience is future-facing; the ability to overcome or withstand shocks and setbacks that are yet to come. We hope that using our data to understand the recent past will help us understand the future prospects of local neighbourhoods, which are most resilient and which are most vulnerable in an unpredictable world.
We will be reporting on this more in the coming months.
A critical element of resilience is future-facing; the ability to overcome or withstand shocks and setbacks that are yet to come.